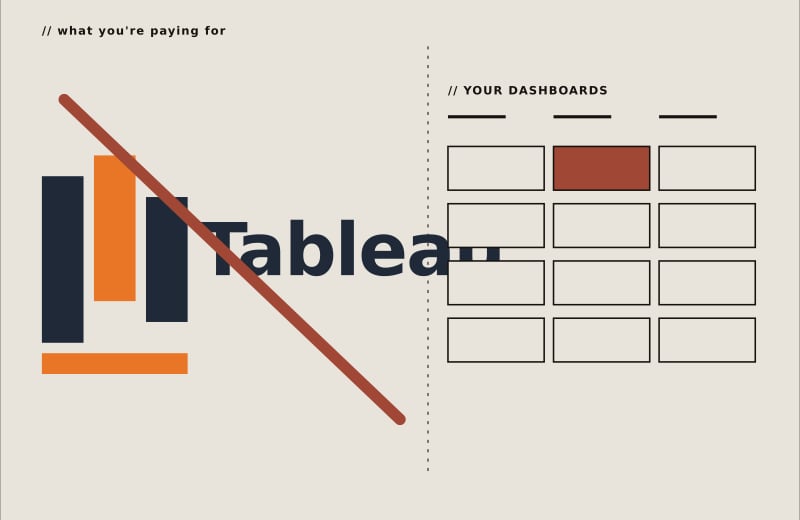
Tableau replacement —
5 charts and a query, not 50.
Custom React + Postgres + a minimal viz layer. We replicate the dashboards your team checks daily and retire the seats that nobody uses. AI-assisted SQL means your ops team can ask new questions without a ticket.
Real-Time Analytics Dashboard Real-time portfolio visibility.
Real client, real dashboard, real seat-license cost retired.
"It's the first time we've actually trusted the number on the screen."
— Chief Investment Officer · Wealth management firm
What we replace, line by line.
Most BI license bills are 80% capability you don't use. We replace the 20% you do — at a flat build cost.
Inventory → replicate → cutover → extend.
-
We catalog every dashboard, view, and saved report in your current BI tool. Talk to the actual users — figure out which 5 they check daily versus the 50 nobody opens. The 5 are what we build; the 50 die with the contract.
-
Schema mapped against your warehouse. Charts built in React with the same layout your team is used to. AI-SQL endpoint wired to a constrained schema for safe ad-hoc queries.
-
Run alongside the BI tool for 2–4 weeks. Side-by-side number reconciliation. Once your team trusts the new dashboard, you cancel the BI seats.
-
Optional: add embedded reporting in your customer-facing app, alerting on threshold breach, or scheduled email/Slack summaries. All without a BI vendor in the loop.
Also worth replacing — other expensive SaaS we get clients off.
Let's build something great.
Tell us about your project. We respond within 6 hours, guaranteed.